
Defining a pitcher as an ace is as difficult as calling a quarterback elite in the NFL; everyone sort of knows what it means, but there is no universally accepted formula to determine who makes the cut.
Currently, determining an ace is essentially based on the eye test. An ace is supposed to be the leader of his team’s pitching staff, a guy who is capable of shutting down any opponent on any given day. It would be easy to simply categorize an ace as the number one pitcher on a team, but that is not necessarily true; some teams are talked about as having more than one ace (think 90’s Braves with Maddux, Glavine, and Hudson), while others might not have a true ace at all. With all of the pitching statistics available today, it seems logical that we could create a statistical basis for what makes a pitcher an ace, and how valuable that player truly is to his team.
Before we begin, let’s talk about the parameters for this study. The general consensus when declaring a pitcher an ace is a consistent track record of excellence—in other words, one great season does not an ace make. Therefore, we will be looking at starting pitcher statistics from 2012-2014.
For these starters, we will use a minimum of 200 innings to qualify. While the number of innings to technically qualify as a starter for this three-year period is 300, bumping the number down to 200 IP allows us to more accurately compare pitchers to league average. This gets confusing, but let me explain: each team in Major League Baseball has five starters, which means that at any given time there are 150 starting pitchers in the majors. Only 108 starting pitchers have thrown 300+ IP in the past three years, whereas 155 pitchers have thrown 200+ IP. Therefore, decreasing the innings requirement makes the data more representative of the whole population of starting pitchers. Weaker fourth and fifth starters are less likely to be given the opportunity to pitch because their production is more easily replaceable, so having a higher innings requirement would disclude some of them and artificially inflate pitching statistics.
Now that we have determined the sample of players, how do we decide which ones are aces and which are not? It is impossible to do so based solely on a statistical threshold because of the changing dynamics of the game. A pitcher with a 3.20 ERA during the steroid era would have been considered an ace, but today that would be barely above average.
One way would be to say that on average each team has one ace, so the 30 best pitchers in baseball are aces. I would argue that this number is too high; as mentioned above, many teams have solid number one starters, but not what is necessarily considered an ace. Another possibility is 20 aces; after all, there were 20 starting pitchers named to the All-Star Game this year. Still, I find this to be too high, as the All-Star selections are chosen based on half a season’s worth of production and can be mere aberrations. For aces to truly be special, they must be a very select and elite group.
So let’s say that at any given time there may be around 15 aces in baseball…that was supposed to be the easy part. Next, we need to determine who these best pitchers are. With the 2012-2014 starting pitching data, we can look at the average pitcher’s performance in four major categories: ERA, WHIP, FIP, and SIERA. Using the normal distribution model, we can determine each player’s predicted percentile compared to league average. Assuming there are roughly 15 aces, pitchers who grade out in the 90th percentile or higher would qualify, but to start we will take a close look at anyone consistently in the top 80%.
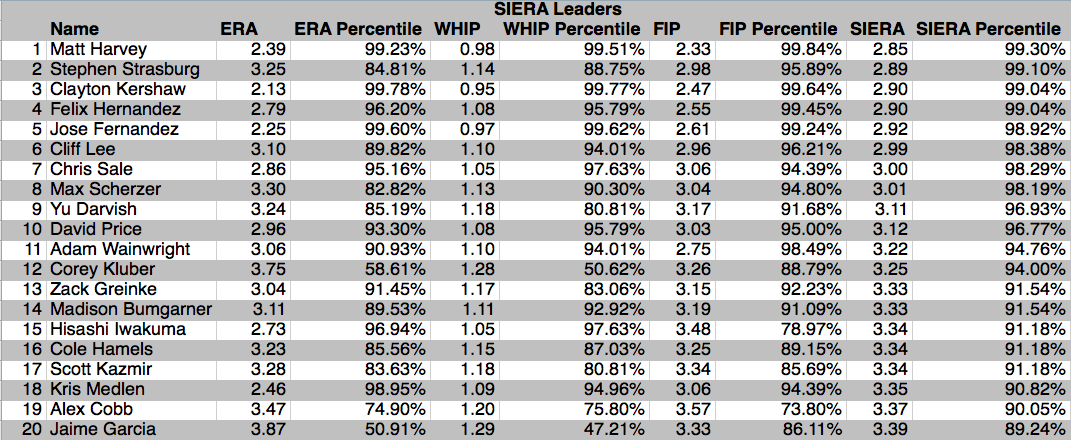

This is a lot of information to process, so let’s break it down by parts. ERA and WHIP (Earned Run Average and Walks + Hits per Innings Pitched, respectively) are standard pitching metrics that have been used for years to demonstrate a pitcher’s value. FIP and SIERA are more sophisticated sabermetrics which attempt to neutralize the variables inherent in ERA and WHIP and are weighted to an ERA scale. FIP, or Fielding Independent Pitching, measures the only play outcomes a pitcher can truly control—walks, strikeouts, and home runs—and puts them on an ERA scale to determine a pitcher’s true value. FIP has been proven to be a better indicator of future ERA for a pitcher than his past ERA, leading to its widespread use in baseball. SIERA, or Skill Interactive ERA, is similar to FIP but takes into account some variables from balls in play, making it even more accurate than FIP. For this reason, the tables above have been sorted by SIERA, as it is the best indicator of a pitcher’s true talent.
A lot of these names make sense. Strasburg, Kershaw, and Hernandez towards the top seems right, as do top ten names like Lee, Sale, Scherzer, and Price. Harvey and Fernandez are both young and out for the season, but when they have pitched they have been lights out. It is interesting to see some players who dropped in the rankings or appeared high on the list. Corey Kluber was a middle of the pack pitcher based on ERA and WHIP, but a borderline ace according to FIP and SIERA. Joe Blanton was terrible by most accounts, yet somehow checks in at 37, ahead of well-regarded starters such as Verlander and Lester (Lester did not even make the list, coming in at 43). Of course, these two starters were hurt by having an uncharacteristically poor year in this span (Lester in 2012 and Verlander in 2014), but it is still surprising to see them so low.
Besides Kluber, all the players in the top 15 rank in the upper percentiles in nearly every category, and could have strong cases made that they are aces of their respective pitching staffs. Some of the players in the 16-25 range could also have strong cases made for them, especially when adding in name recognition (Hamels, Cueto, etc). The problem is, some of these pitchers just might not have been around for long enough to really be considered aces. Guys like Harvey, Fernandez, and Medlen are injured and only have a short track record of excellence. Now let’s take a look at the same sample of starters and rank them based on WAR (Wins Above Replacement) to see how much they have contributed to their teams in the past three years.
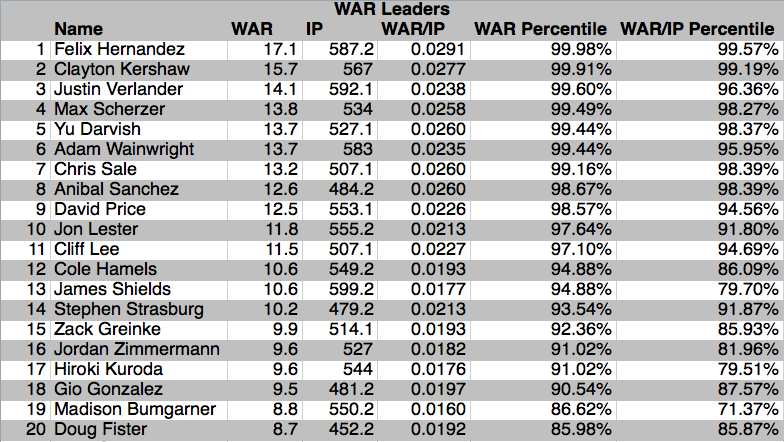
This list certainly passes the eye test. All of the pitchers in the top 15 are studs, who based on public opinion would probably be considered aces. Guys like Verlander and Lester, who were hurt by down years in the averaged statistics like ERA and SIERA, are back atop the list due to their contributions the other two seasons. In addition, players like Harvey and Fernandez, who rank among the league leaders in WAR per inning, are not at the top of the list for WAR because they simply have not pitched enough. If both pitchers are able to successfully recover from injury and continue performing at a high level, they will move up this list in the future and become worthy of the term ace.
What I draw from this study is that WAR is the best indicator of who is an ace. While the four stats from the first table are important indicators of a pitcher’s ability, WAR is a better representation of a player’s overall contribution to his team and is not weighed down as much by one uncharacteristic season. Plus, WAR takes into account that pitchers who stay healthy and throw more innings are more valuable to their teams. WAR/IP is still useful to show a pitcher’s effectiveness when he does pitch, but WAR is more encompassing of his true importance.
Still, the statistics in the first table are essential to back up the WAR evidence. Having ERA and WHIP side by side with FIP and SIERA shows how the old and new metrics usually lead to similar takeaways, but sometimes discrepancies between them raise valid concerns about our perceptions of players. We can also use these stats to argue about “bubble aces,” if you will. For example, a pretty compelling case could be made for Madison Bumgarner as a blossoming ace based on his advanced pitching stats, while James Shields might be bumped off that pedestal after examining his.
To conclude, let’s set some basic statistical guidelines for determining an ace in the future. Pitchers who for the last three seasons have ranked in the 95th percentile or higher in WAR make the cut; pitchers from around 85%-94% are on the bubble, largely determined by statistics such as ERA, WHIP, FIP, and SIERA. And at the end of the day, some of our own bias goes into the decision as well. Being an ace is about current performance, but that does not stop us from remember Cole Hamels’ lights out showing in the 2008 postseason or Strasburg’s incredible final year in college. These prejudices will always impact our decisions—and perhaps to an extent they should—but having a statistical backbone allows us to compare players and better understand their abilities.

Pingback: Josh Reddick: The Reason Lester Became an Athletic | Scouting, Stats, and Stuff